What is Trading View, its features, and How to Use it
Traders use analytics tools to plan their entry and exit points to increase the chances of profit from the trade. To get the data, traders opt for several platforms; among them, Trading View is one of the best platforms. In this post, we have given you the details about TradingView, its features, and how to use it, so let’s get started.
What is Trading View?
It is a web-based cutting-edge charting and trading software that offers trading tools for traders and investors. With the real-time data of market analysis tools, a user can make informed financial decisions.
However, the company was started by the CEO (Denis Globa), CTO (Konstantin Ivanov), and COO (Stan Bokov) in 2011, and its headquarters are in New York and London. Currently, the TradingView platform is known as one of the most used traders and investors sites, with users of over 50+ million.
Features
1. Pine Script Programming Language
The advanced Pine ScriptTM programming language is the perfect algorithm that can work for hundreds in other languages. It also allows its users to make custom indicators and trading strategies.
2. Social Networking Community for Traders
The platform has an inbuilt feature to communicate with a vast community of traders. User can share ideas, strategies, and analyses and follow their favorite ones, join live streams, and much more that adopt a collaborative learning environment.
3. Technical Analysis
With the help of technical analysis tools, traders can sharpen their trading decisions. This software offers 100 plus in-built indicators, uncountable community-in-built indicators, volume profile indicators, and candlestick recognition technical analysis tools.
4. Financial Analysis
Another incredible feature of the Trading View platform is that it offers financial analysis. Including 100 plus fundamental fields and ratios, financial statements to explore balance sheets, income and cash flow statements, valuation analysis to know what companies are worth, historical data of companies, and worldwide coverage of markets data.
5. Screener
The screener tool enables traders to filter and scan stock, forex, crypto, and other assets rapidly and straightforwardly. Helping to detect trading opportunities based on technical fluctuations, performance, volatility, trend ratings, value changes, and others.
6. Dynamic Trading Alerts
Traders can sync with the markets and set up the 12 alert conditions on prices, indicators, and strategies to get notifications when conditions are met. Moreover, traders can also select how they want the notifications to be sent, like email, text, or push notifications.
7. Real-time Market Data
This software offers real-time and historical data of markets for a wide range of assets like forex, cryptocurrency, indices, and stocks letting the traders spot the trading opportunities.
8. Advance Charts
One of the main features of Trading View is its advanced and user-friendly charts. Traders can also customize their charts with various technical indicators, drawing tools, and overlays. It helps them easily perform detailed technical analysis.
9. Paper Trading
For novice traders, this platform offers a paper trading feature that lets them practice trading strategies without risking the actual money. All this indirect trading setting lets a trader gain assurance before implementing live trading.
10. Mobile Application
Traders can access this software from their iOS and Android smart devices, so you never miss any opportunity and monitor your trade on the go.
How to Use Trading View Software
If you want to use this platform to execute the trading, then you must create your account. Once you have signed up for your account, then follow these below-mentioned steps.
- On the dashboard of TradingView, you will see charting tools market watchlist, a community, and other features.
- Here, select the financial instrument that you want to analyze and customize the chat with your preferred technical indicators like moving average, Bollinger bands MACD, and drawing tools.
- Now, conduct a technical analysis via the indicators on your chart. Here, pay attention to price patterns, support and resistance levels, and other important elements influencing your trading decisions.
- When you have identified a trading opportunity, place trade directly from the TradingView software. Moreover, select your trade size, set stop loss, and take profit levels. Then, connect to your broker account to execute trades seamlessly.
- Once you have executed the trade then monitor it closely for any changes in the market conditions. Use the built-in alerts of this trading software to get notifications if the trade reaches certain price levels.
- Share your analysis ideas and strategies with the community of TradingView. Similarly, learn insights from other traders and build connections within the social community.
Analyze the Chart on Trading View
When analyzing a chart on this software, you have to study the price movements, identify patterns, and apply technical indicators to make informed decisions. Here, we have shared the steps to analyze a chart.
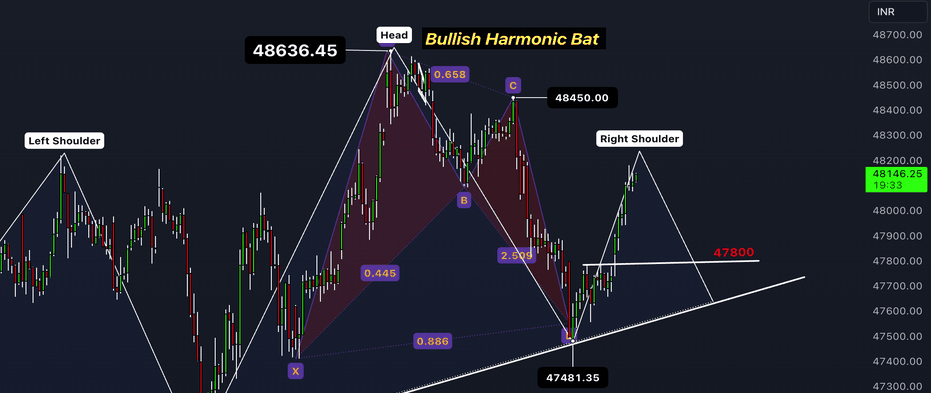
- First of all, look for common chart patterns like head, shoulder, double tops, or triangles. Because they can indicate the price reversal or continuations.
- After that, apply technical indicators like RSI: Relative strength index, moving average convergence divergence, and stochastic Oscillators to get insights into market trends and momentum.
- Then, locate critical support and resistance levels on the chart, as these levels are important barriers to price movements and guide you to the entry and exit points.
- Now, observe trading volume to measure market participation and the strength of price movements. Frequently high volume can signal a trend reversal or continuation.
Who Should Use this Platform?
The trading view platform offers various audiences, making it a complete platform for every individual with different trading purposes.
- Experienced Traders: This platform caters to advanced technical analysis tools and real-time data, which experienced traders appreciate. Moreover, the features also allow experienced traders to implement complicated trading strategies.
- Beginner Traders: TradingView is a supportive platform for those who are new to trading with educational resources and a community to learn from. However, the interface is quite user-friendly and lets a beginner navigate the platform without any difficulty.
- Long-Term Investors: A long-term investor can use this platform to stay UpToDate with the current market trends, monitor their investment collections, and make informed decisions based on the data.
- Technical Experts: The extensive chart capabilities and numerous technical indicators of the trading view platform benefit the technical experts. It allows them to conduct detailed analyses and detect trading opportunities.

